Language
Politics and War is created in English, but we offer a translation option to translate the game into your preferred language. Please note that the translation is automatic based on Google's neural translation and not perfect, but our goal is to make the game as accessible as possible for all players.
Note: This popup will not appear again. If you wish to change your language in the future you will be able to find this language selection option in the website footer or on
the Account Page.


 Total: $13.2 trillion USD (2024)
 Total: $13.29 trillion USD (2024)
 0.482
0.482


Replies
nice bulletin, but my eyes hurt
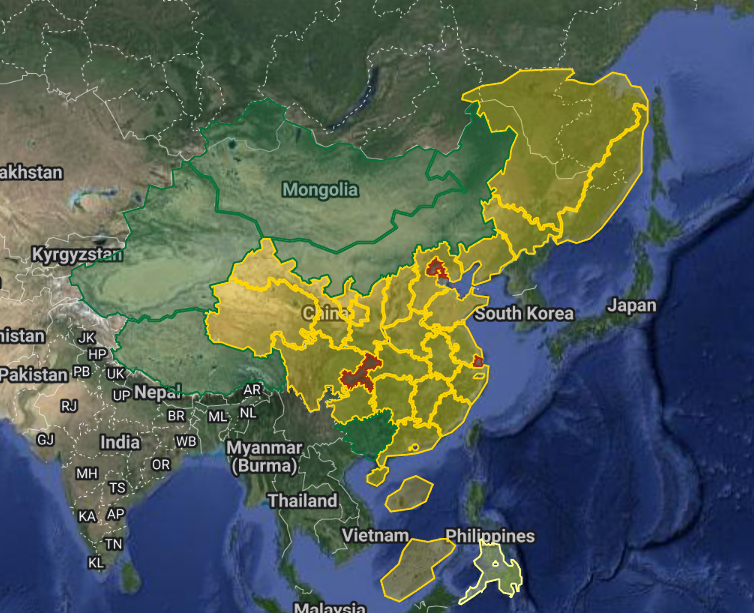
I realise that some of these stats may seem unrealistic. The GDP is just the GDPs of Mongolia, Xinjiang, Qinghai, Tibet, Gansu, Ningxia, Shaanxi, and Sichuan added together with a bit of rounding up for simplicity's sake.
Here's some sources for the natural gas:
The natural gas is the addition of all of the stats in here (For the Global Times one, the natural gas stat is annual so I just divided that by 365) with a 2% increase. Keep in mind these stats are 2022-2023 and RP is in 2095 so I'm pretty sure a 2% increase isn't unrealistic. From what I can tell (I'm not a professional as you can tell), these natural gas fields aren't declining in productivity.
Here's my source for the oil:
What I did was I added up the stats for Xinjiang, Gansu, Tibet (Which was 0), and Qinghai and give it a 2% increase. I used the stat for Sichuan, Ningxia, and Shaanxi and gave it a 10% decrease because it is the only one that decreased in production this year and then added that to the rest. I added the two stats together and then turned it from tons (Imperial) to tonnes (Metric). I then divided that by 365.